Calibrator
I designed a comparison feature for Google's historical construction costs database.
Impact & measurement
Granular cost comparison.
Users can compare cost items at the lowest level, including cost-per-unit, across projects with non-uniform coding.
Reduced comparison friction.
Project detail cards and expandable categories help users find relevant data without manual cross-referencing.
Validated through user testing with GR+D cost analysts; adoption tracked via feature usage after launch.
Role
Product Designer
Client
Google GR+D
Employer
Outer Labs
Focus areas
Design, Prototyping
Team scope
Sole designer; collaborated with product and engineering. Addressed non-uniform cost coding and one-to-one comparison constraints.
Background
Calibrator is a database tool categorizing all cost data of Google's built projects (the data is still being input from a variety of disparate sources). This feature allowed for direct cost-comparison at a very granular level. Previously projects could only be compared across higher levels of data, but users requested a more fine-grained ability to really get in the weeds.
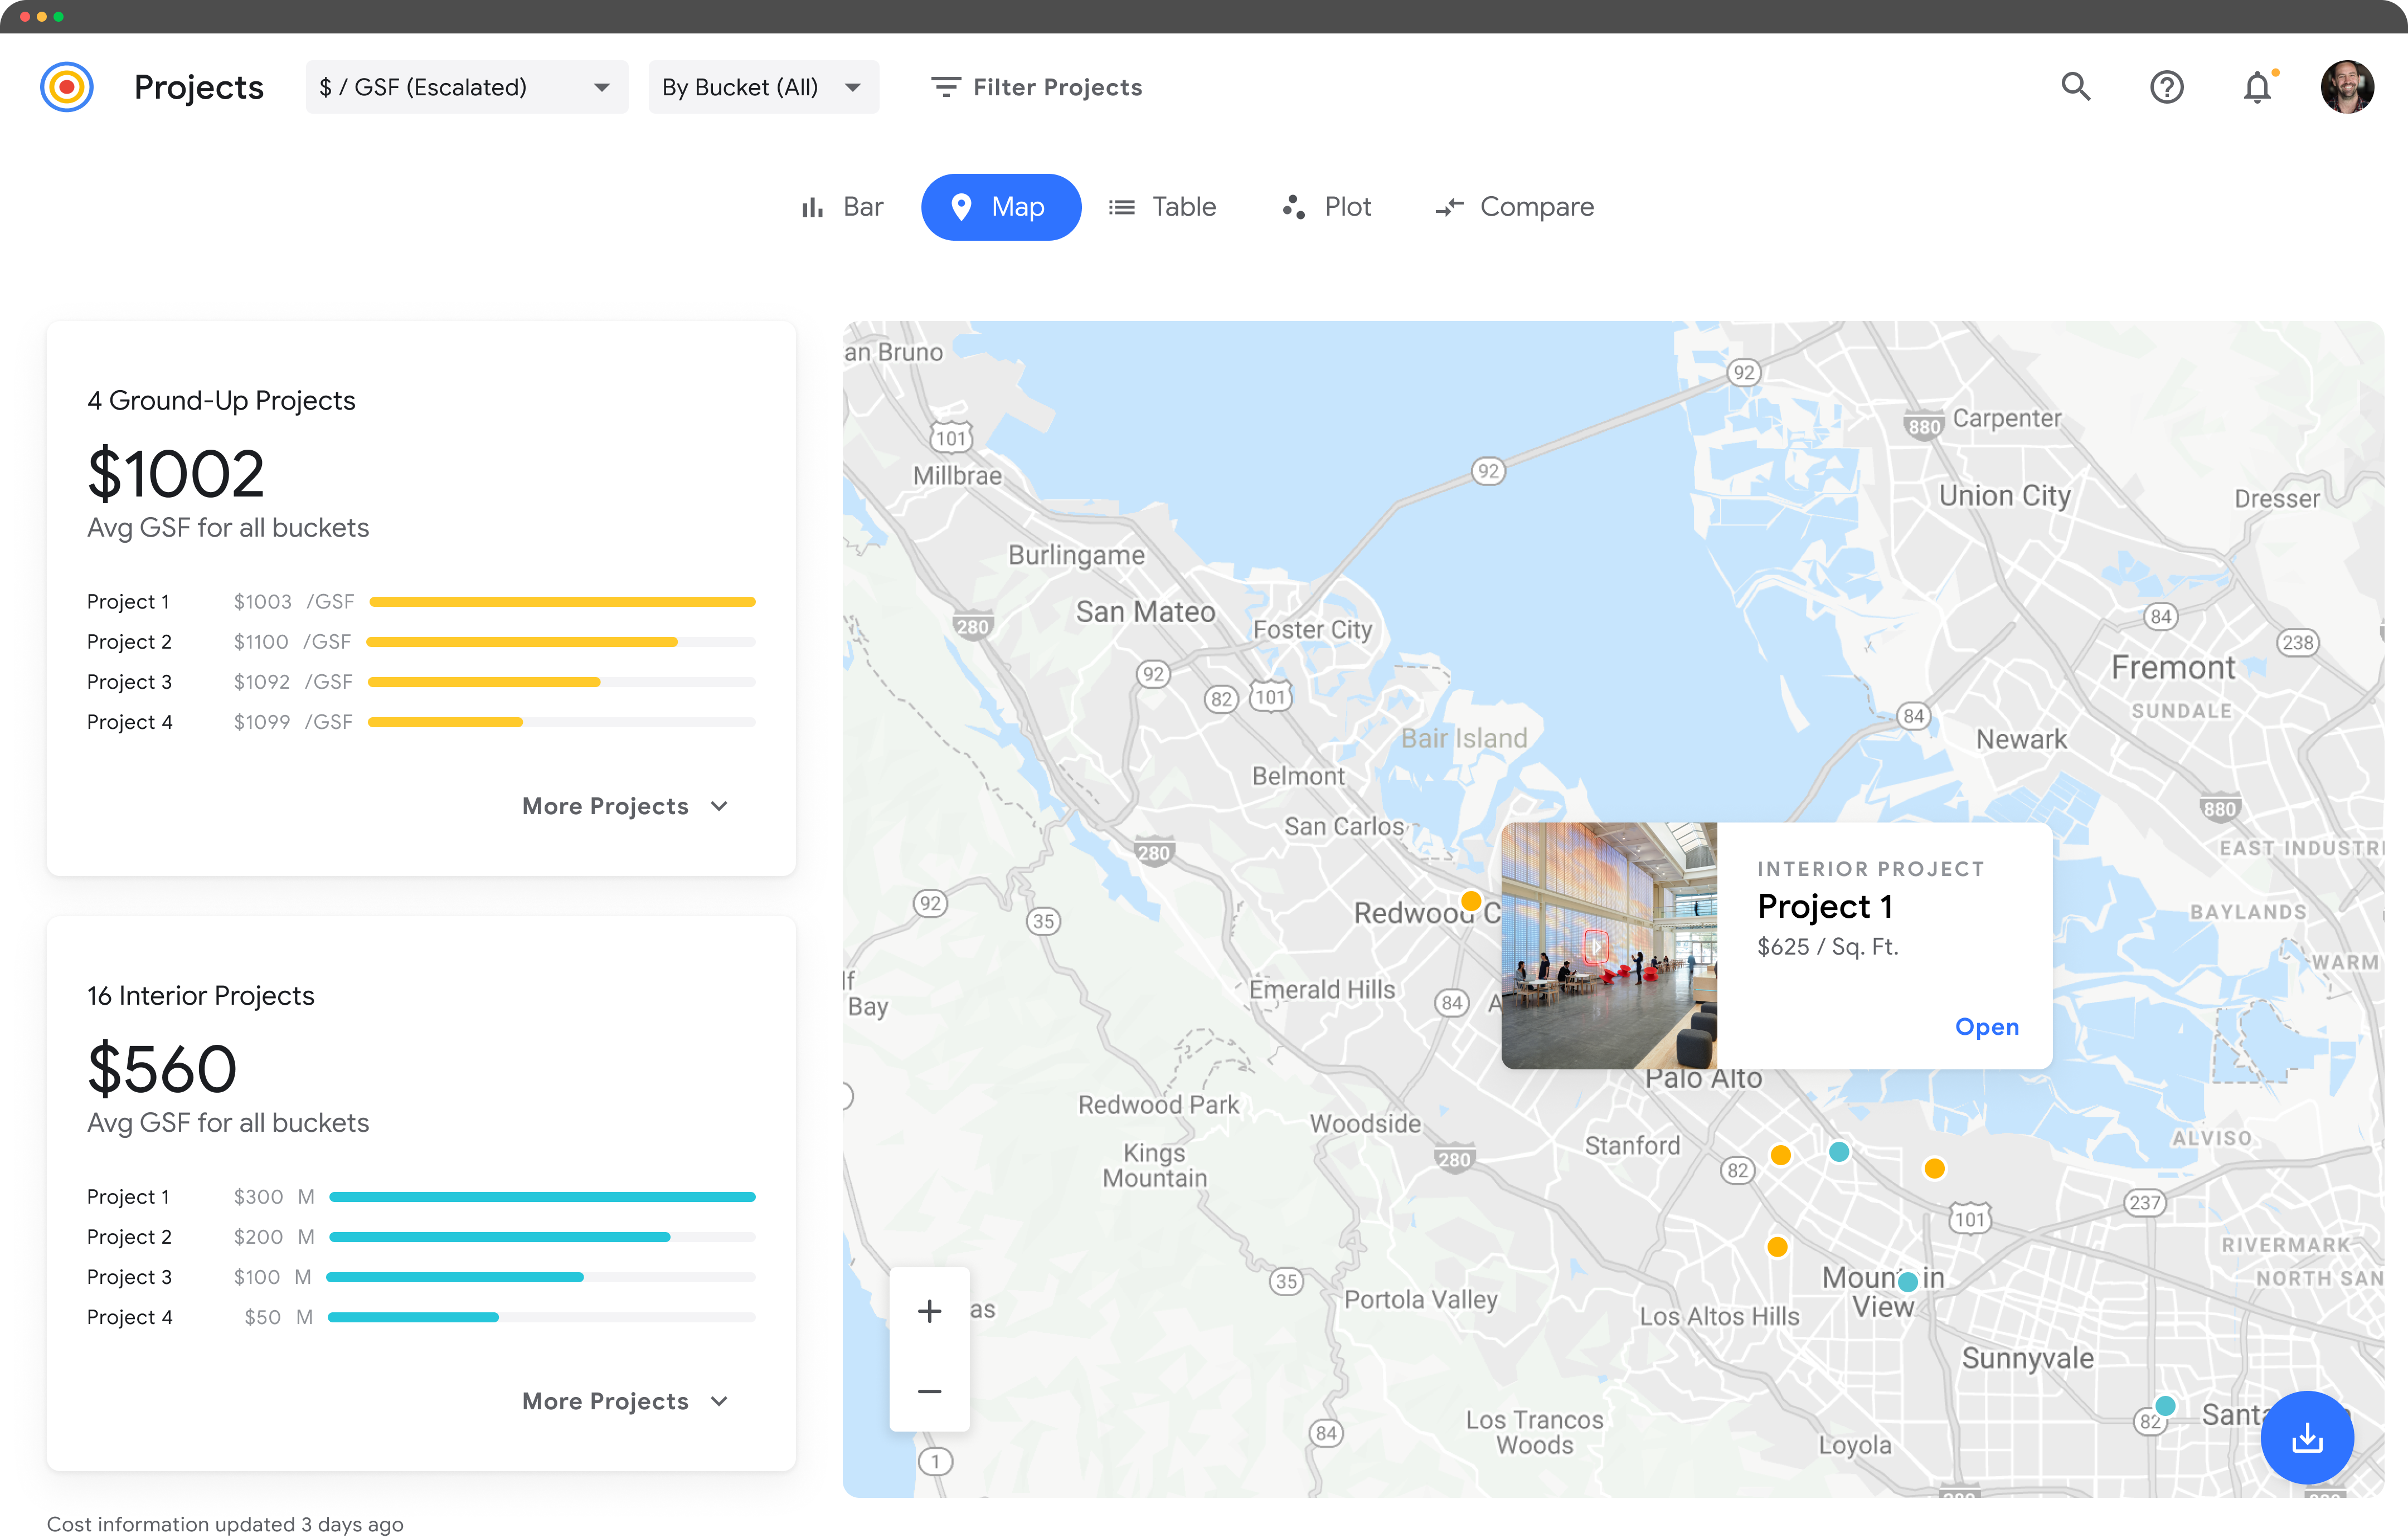
Landing screen for Calibrator
Challenges of construction cost coding
The cost data for construction projects is organized into a series of buckets. Google uses a proprietary system that does not categorize the lowest level items uniformly. This means that users need to compare cost items that may not have a one-to-one relationship. Additionally, at the individual cost item level, users are interested in not just the overall cost of an item but also the cost per unit, and how much each unit costs.
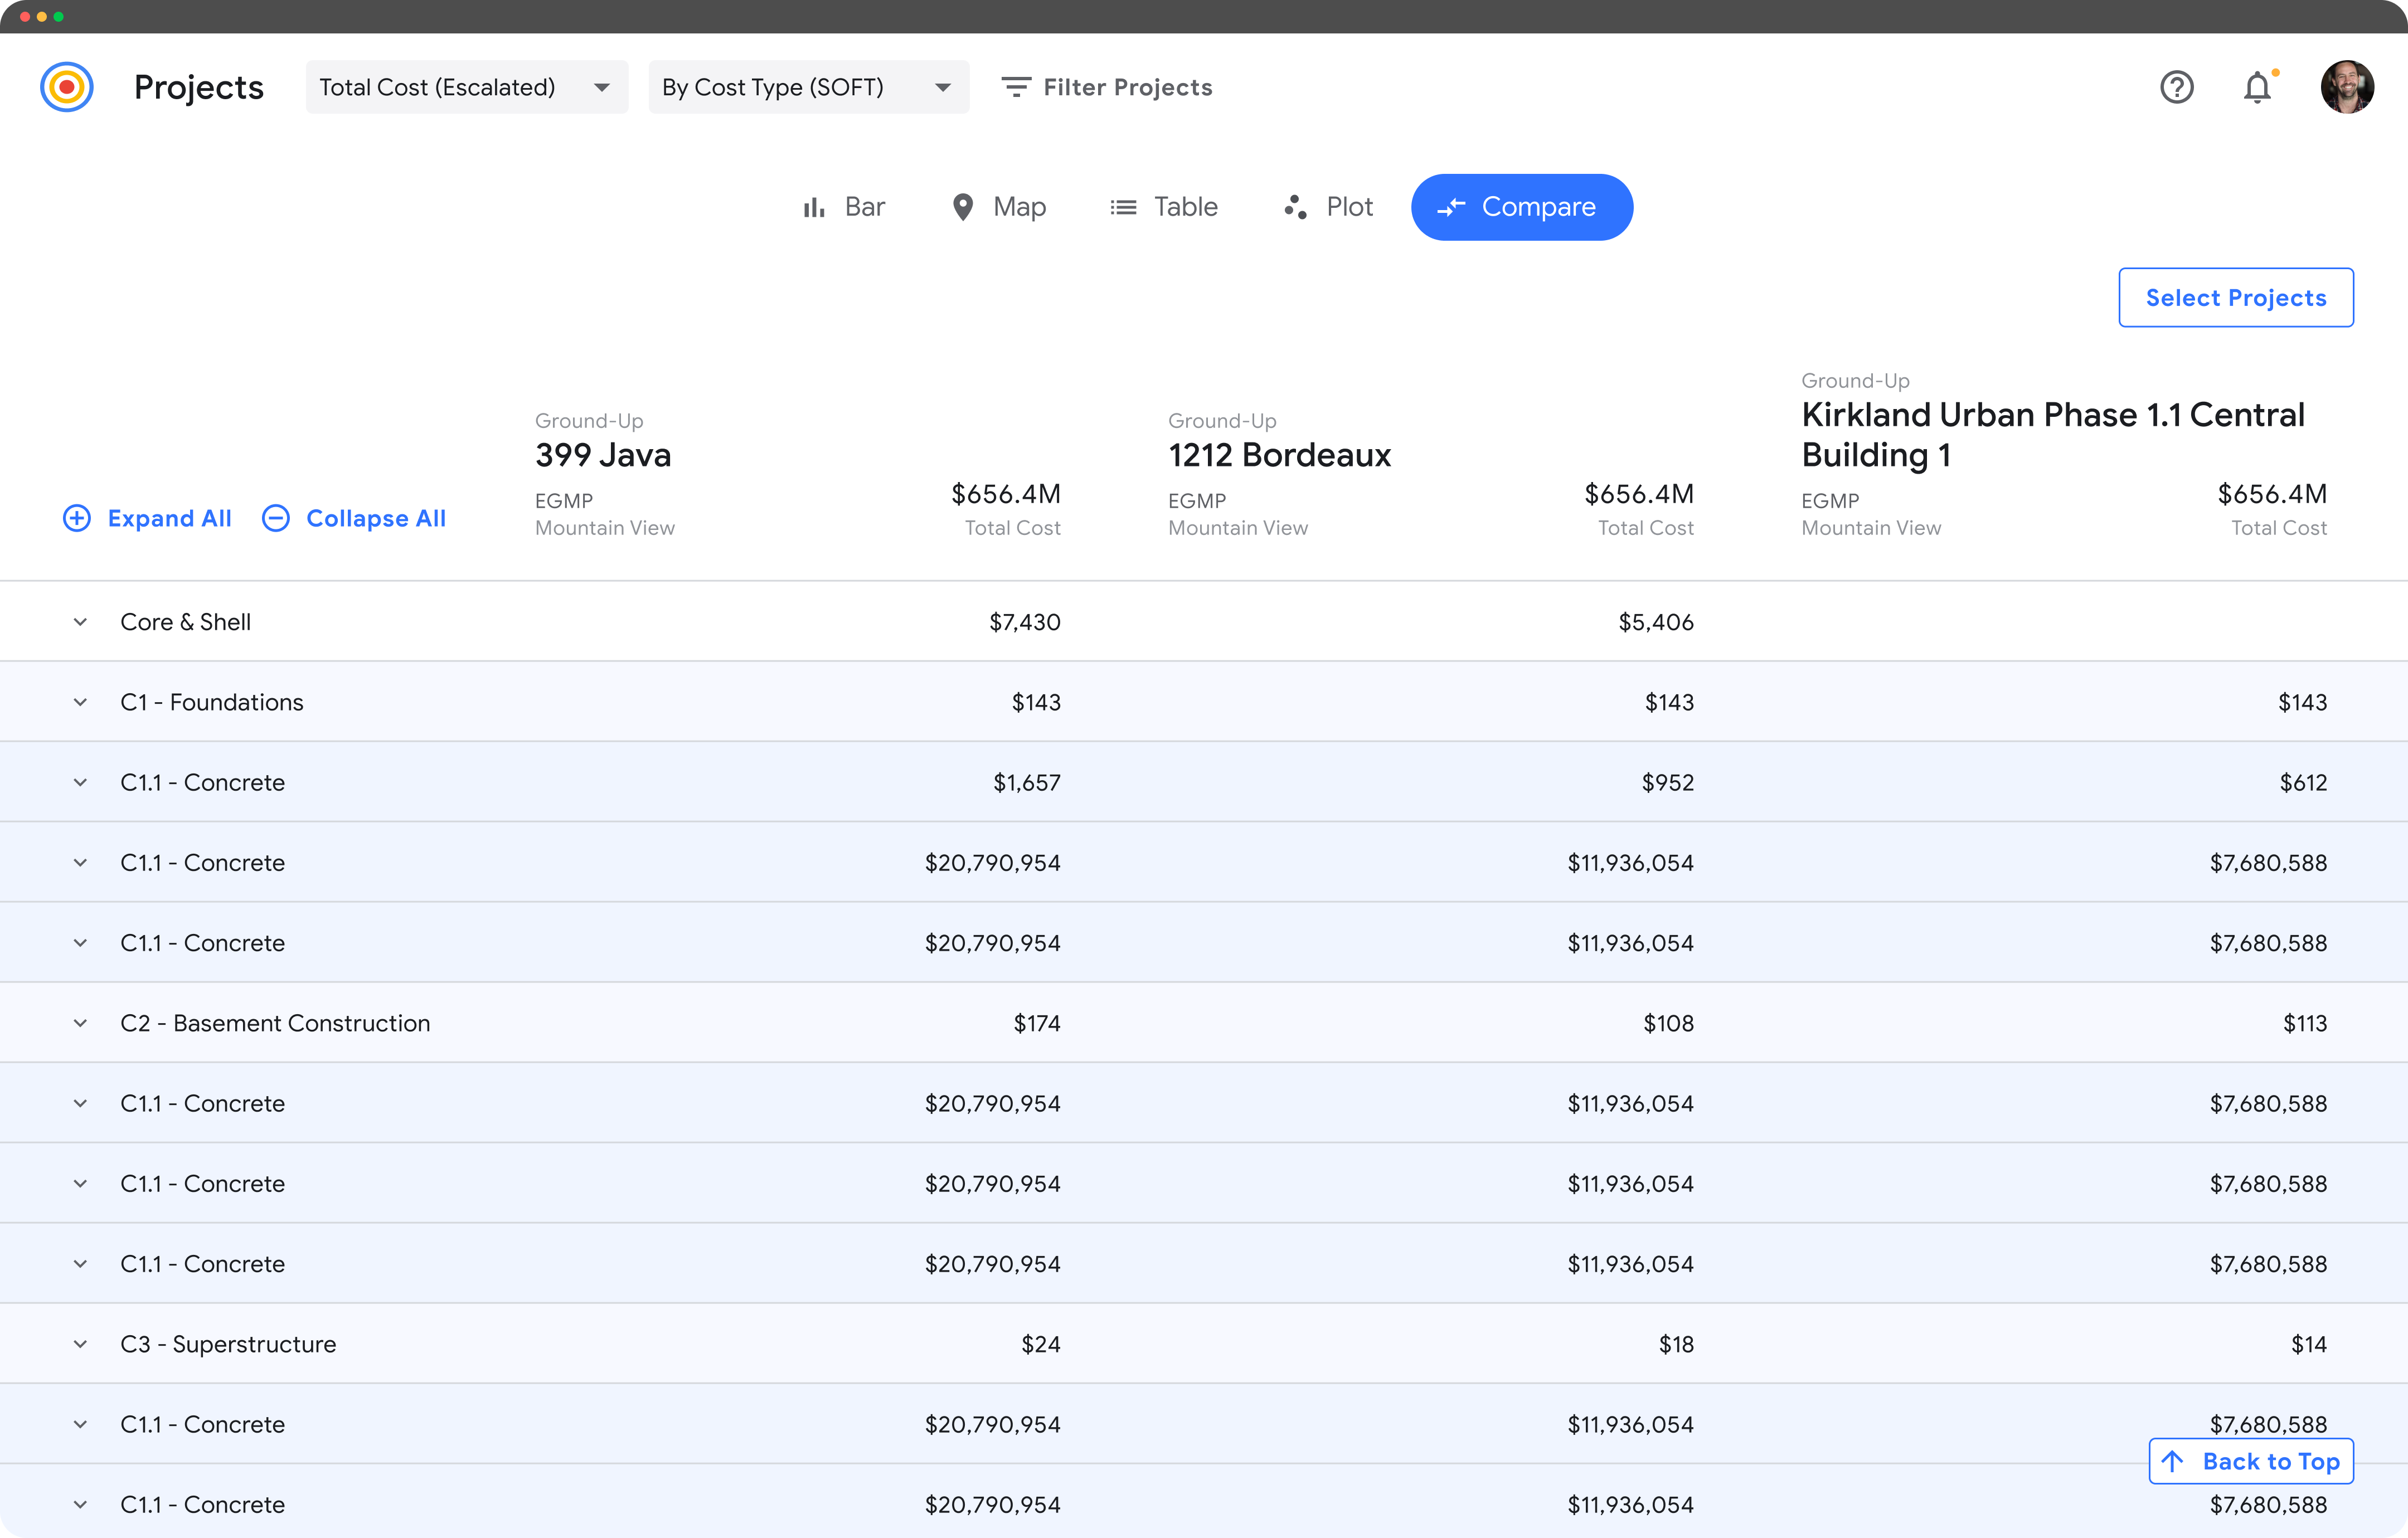
Side by side comparison of big buckets of data
Selecting projects
The first step in a comparison across projects is to help a user select the right project. The list of projects is long, and names of projects are not always helpful in deciphering which one is which. A robust project search feature was de-prioritized for the launch of this feature, so instead I designed a project detail card that allowed a user to see relevant data about the selection that they made.
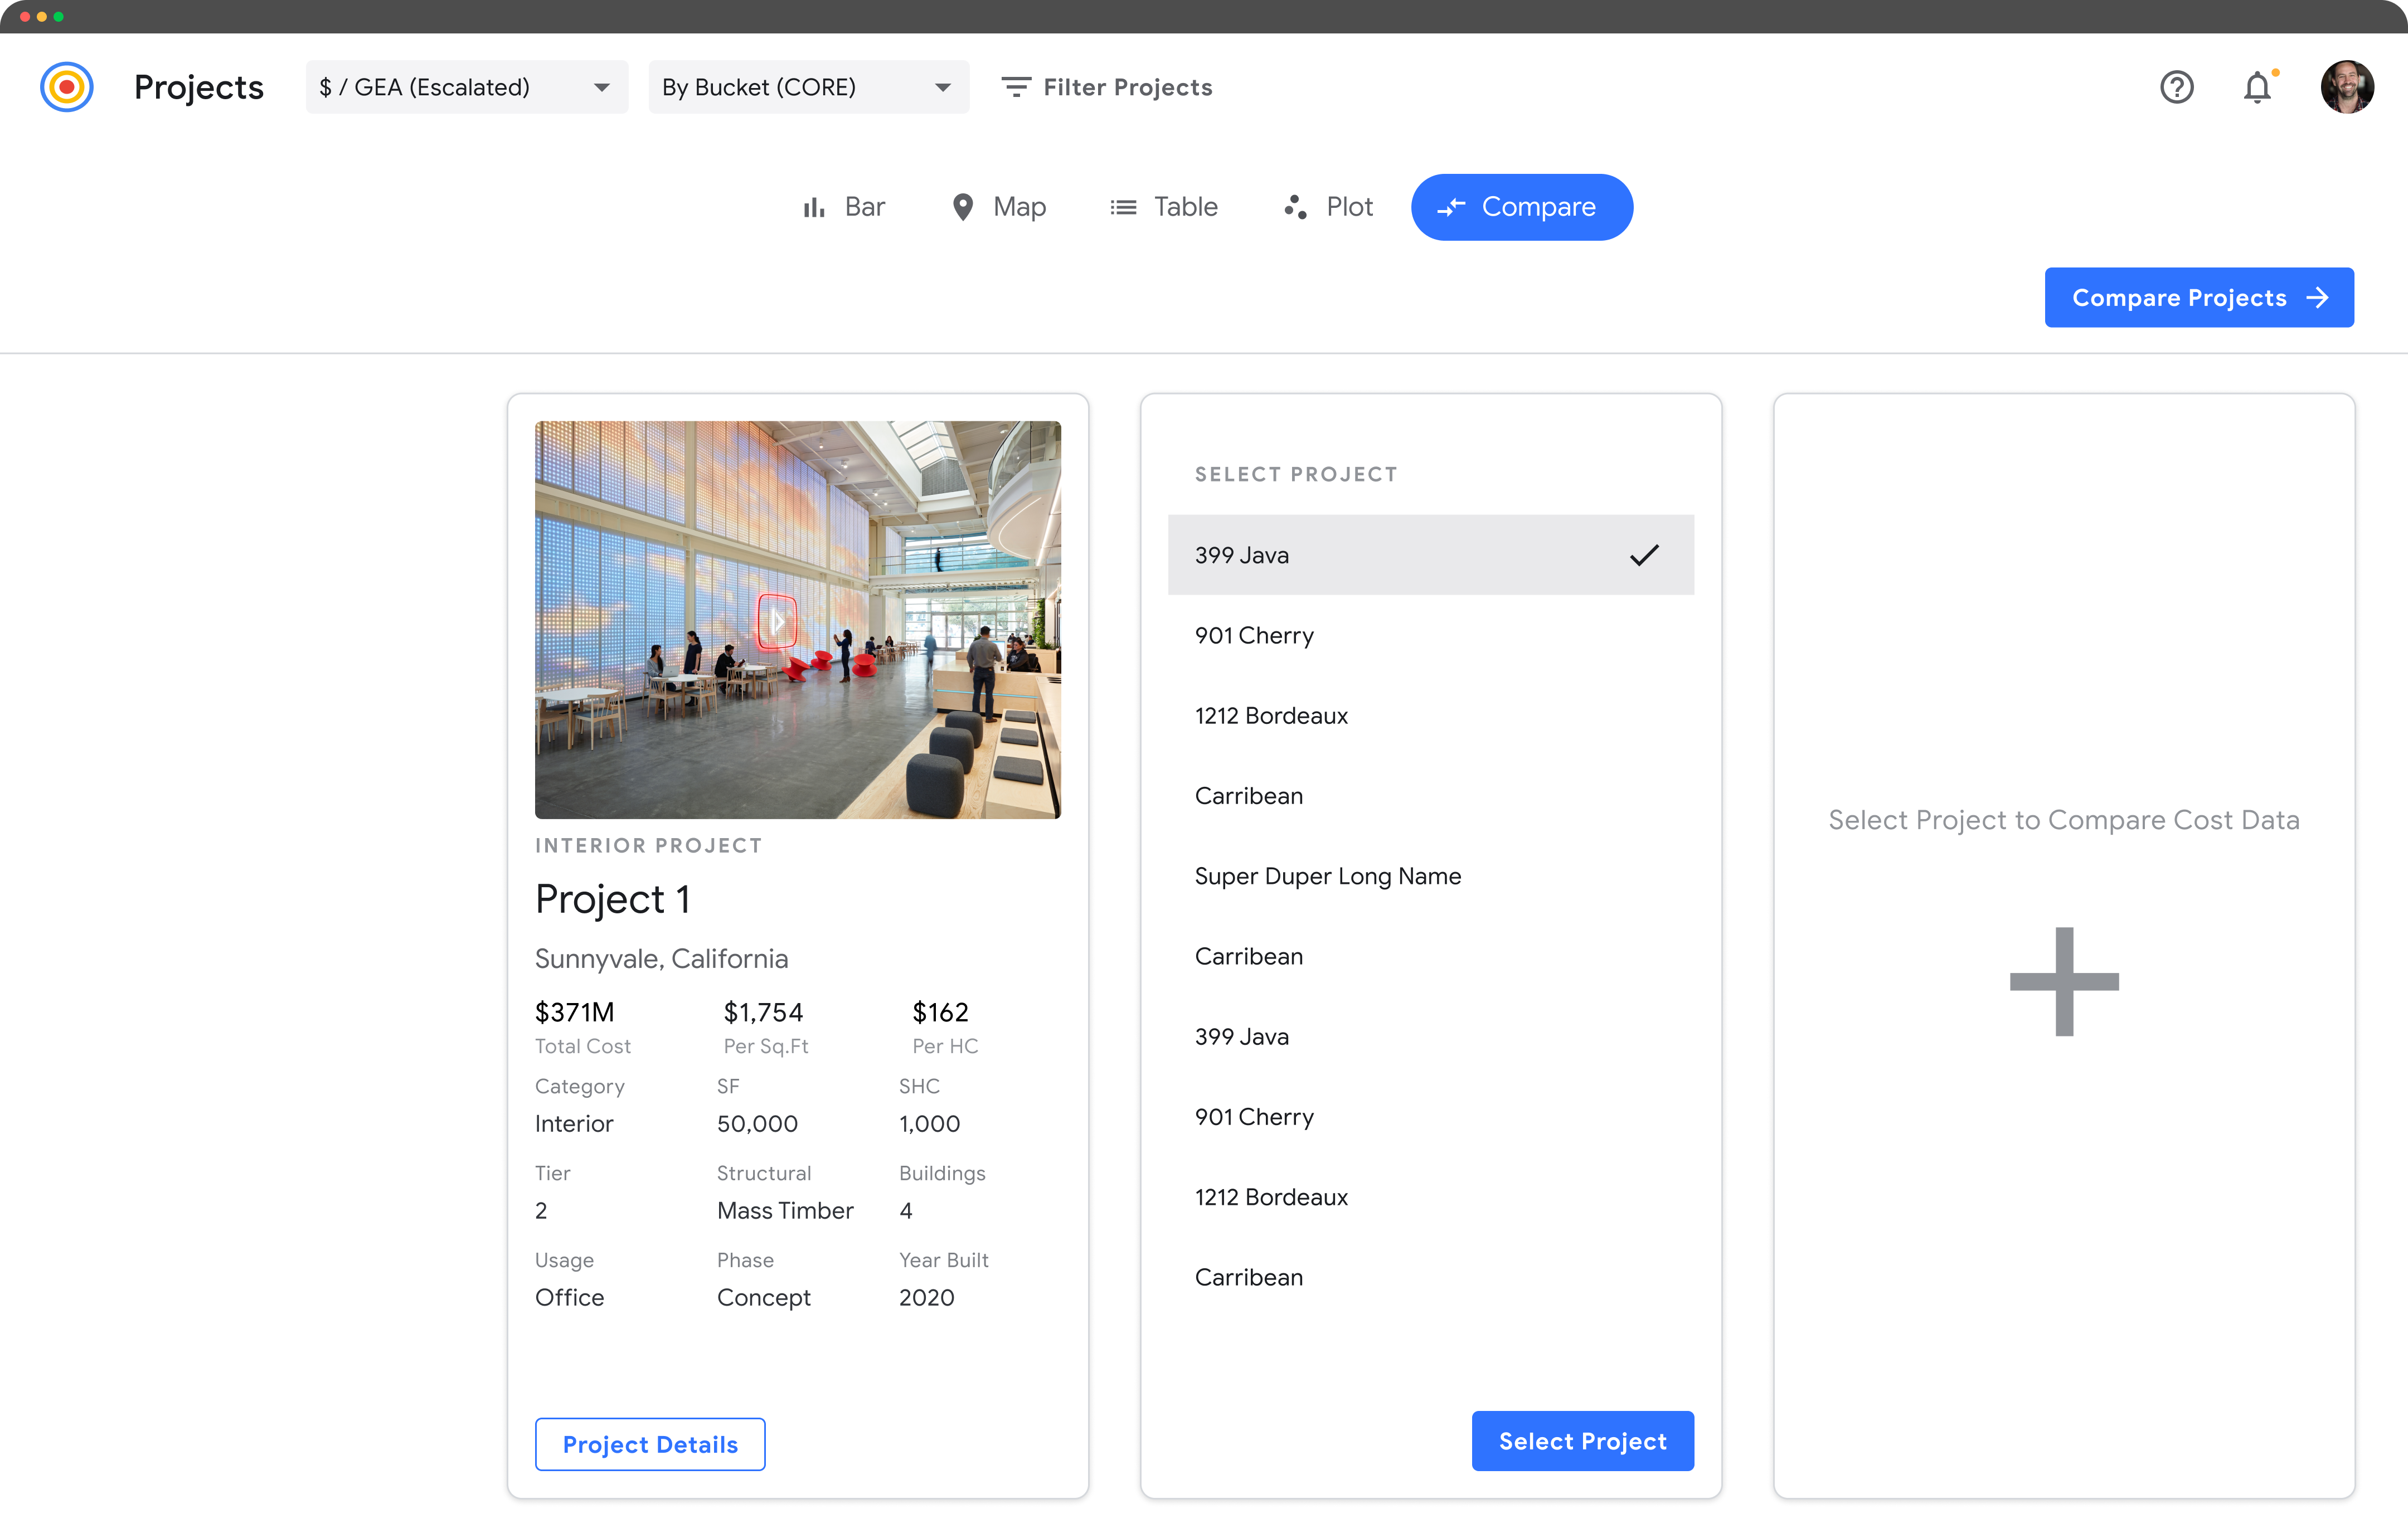
Project selection options
Comparison table
The comparison table is relatively straightforward, with the exception of the lowest level items. A card allows for more data to be displayed for each items, without becoming too dense. Users are able to expand and contract categories as well as filter data to find the relevant information.
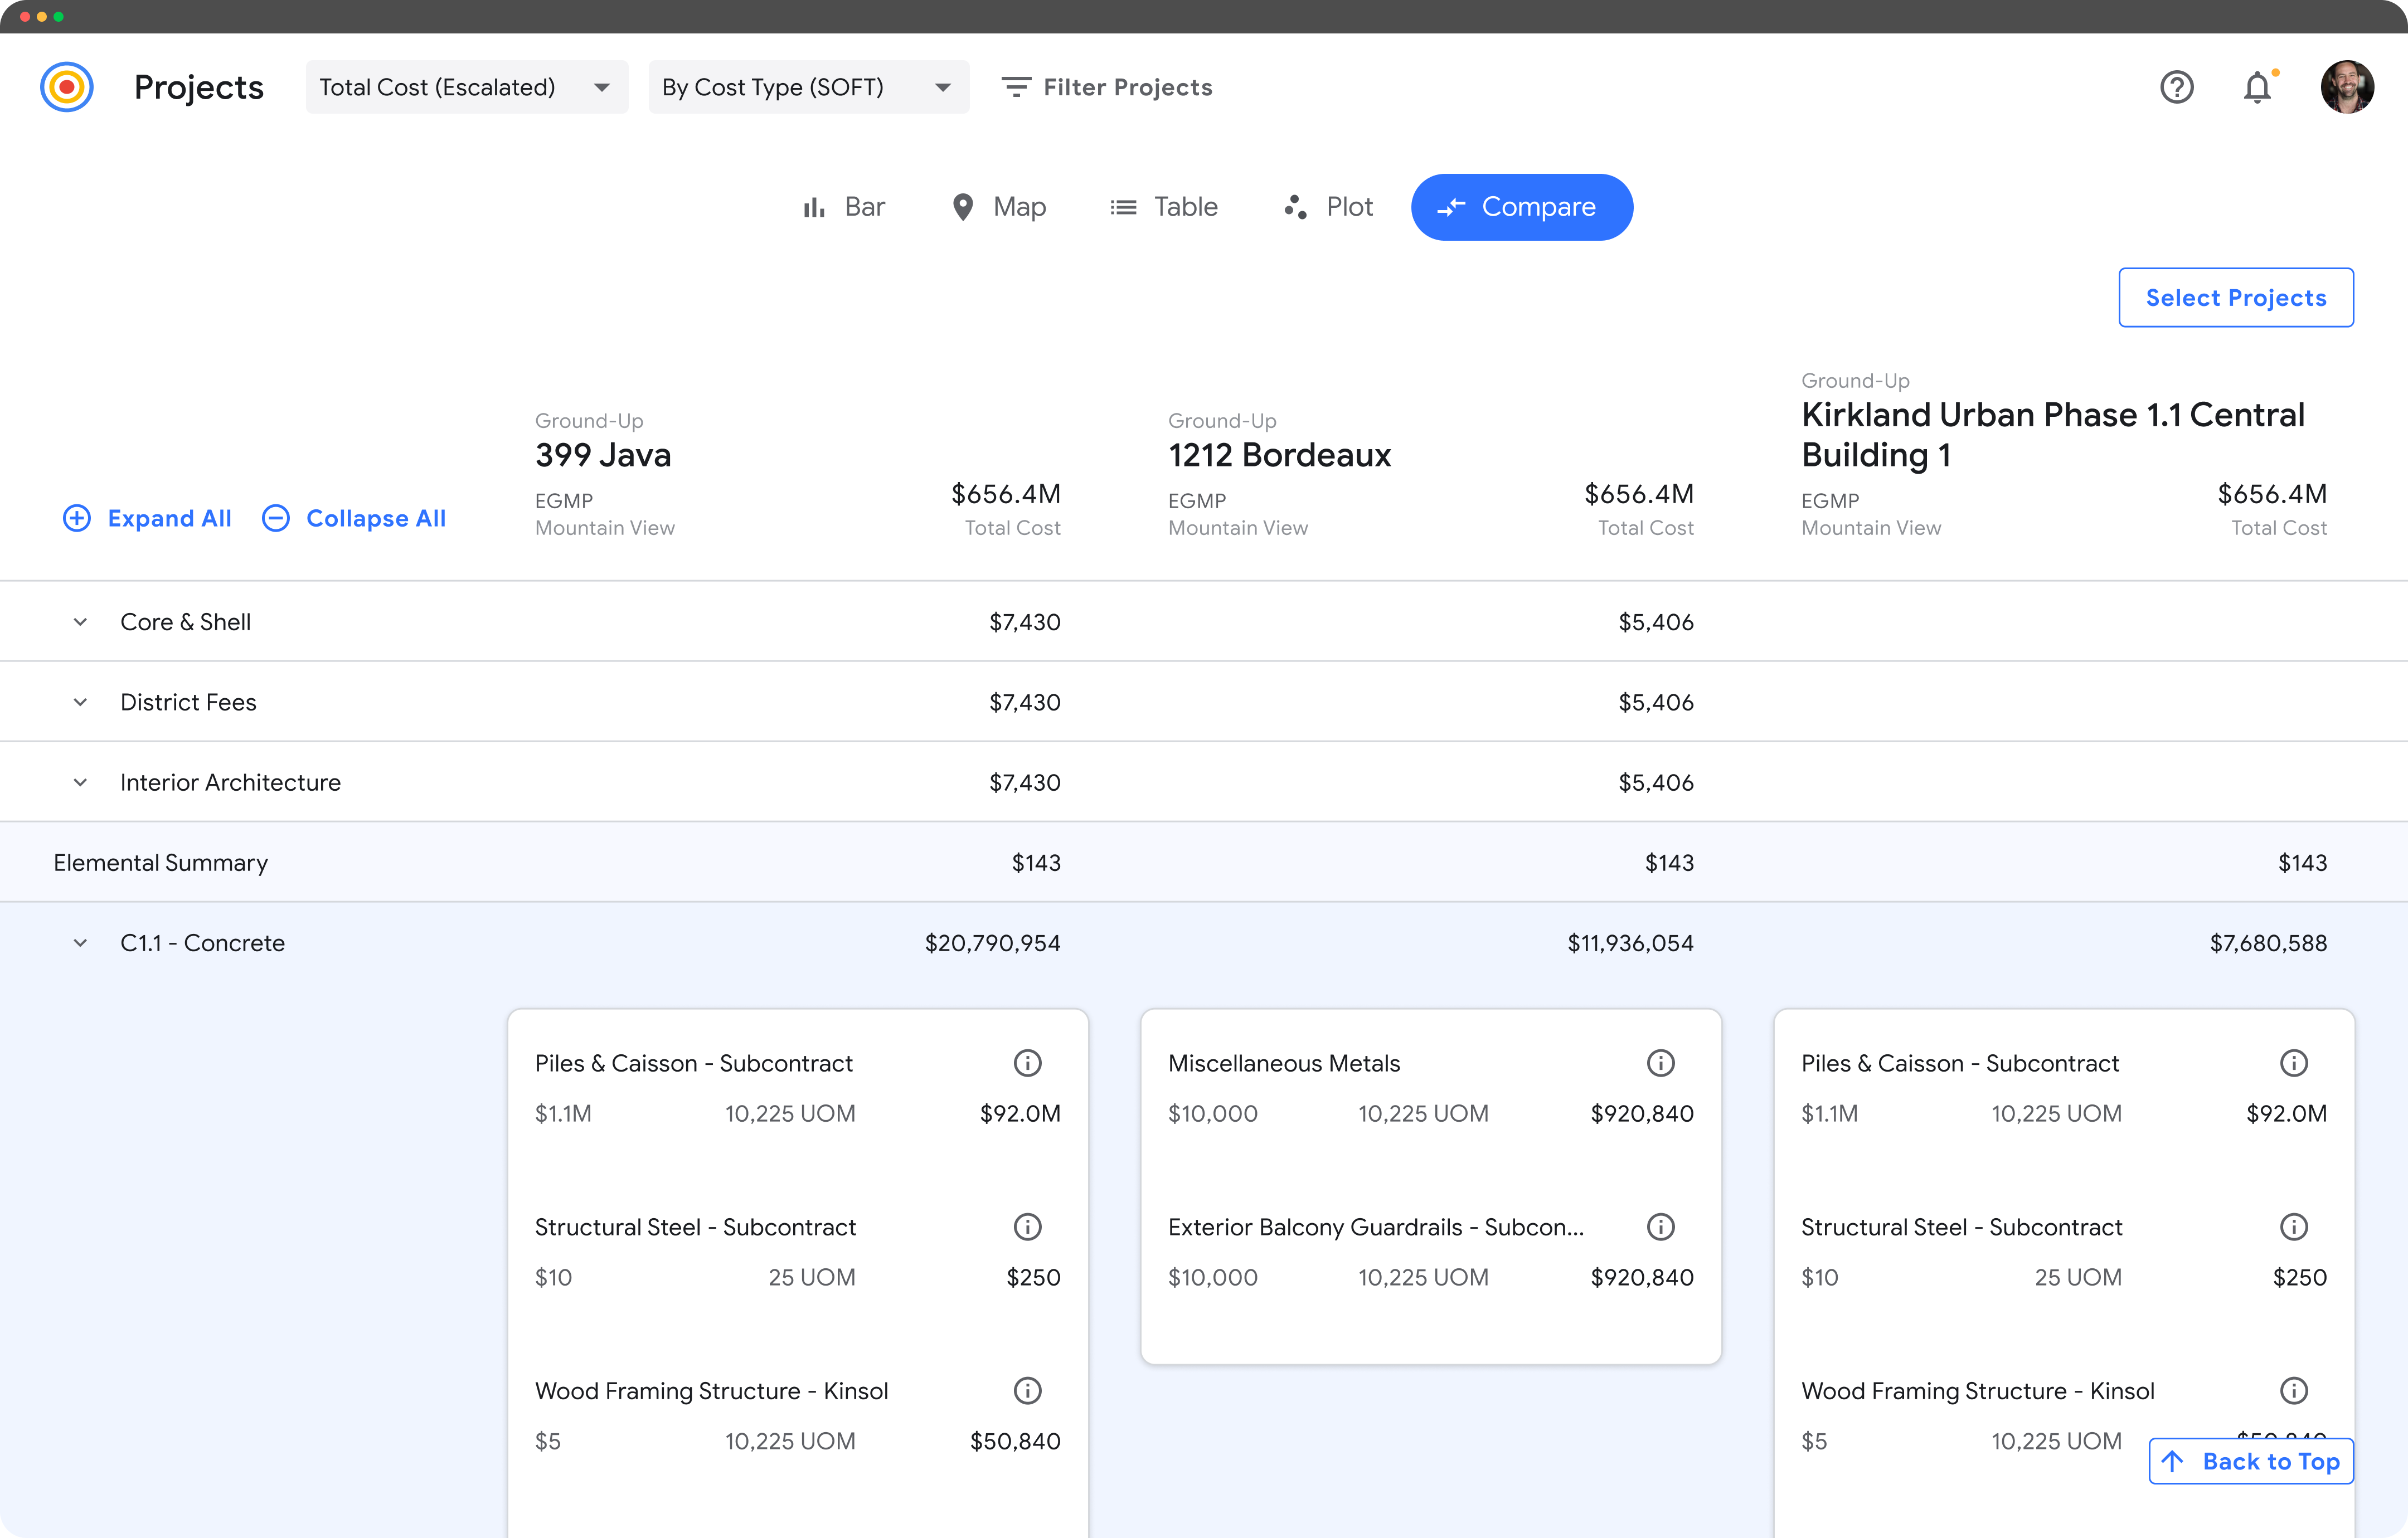
Fine grained data comparison